
Some tools for thinking about the economy worked less well during the pandemic. One such instance involves the productivity-pay gap. A famous chart from Larry Mishel at the Economic Policy Institute shows worker productivity and worker pay diverge after the implementation of neoconservative economic policies during the early 1980s. Updating this chart or its variations with recent data shows a strange bump in both productivity and pay, during the pandemic. These misleading bumps come from “composition” changes in the data and have already been the source of some confusion.
The issue is that the businesses that were closed during the pandemic (for example for public health reasons) were disproportionately less-productive and lower-paying than the ones that stayed open. And since only people who are working and only businesses that are open get counted in measures of productivity and pay, both measures increase sharply during the pandemic.
Of course, we know that our society did not become more productive or higher paid when millions of people were laid off; collectively we became less productive and lower paid. There were major supply shortages and unprecedented needs for government support. The data gives the opposite picture because the sample used to calculate the result was reduced and the composition of the people in the sample changed. The bumps come from excluding a large number of people from the measure during the pandemic.
So how do we get around the composition issues? One technique is to keep the full sample over time. For example, if someone loses their job, rather than remove them from the sample used to measure wages, keep them in the sample and count their wage as zero. Likewise, rather than measure productivity per hour of work, measure it per person, whether the person is working or not.
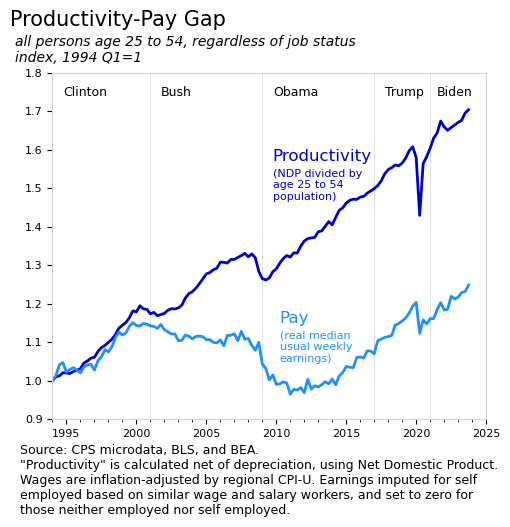
That’s what I’ve done with the above chart, which shows productivity and pay for the 25 to 54 year old population. The age 25 to 54 group is sometimes called the “prime age group” in labor economics as they are employed at the highest rate. The pay line shows median inflation-adjusted usual weekly earnings, regardless of job status. The productivity line divides net domestic product (GDP excluding depreciation expenses) by the age 25 to 54 population.
These techniques aren’t perfect1, but they are useful for showing what took place during the pandemic without the composition effects. The actual story during the pandemic was the layoffs; society was producing and earning less. Most economists seem to compare current data to 2019 to exclude pandemic effects, but this approach won’t work in some cases, such as when isolating the different presidential terms. In this case, a measure that makes 2020 look very good instead of very bad has the effect of creating a false baseline for the Biden presidency. The irony here is that Biden has reversed the anti-union rhetoric of the previous presidents and is actually addressing the productivity-pay gap.
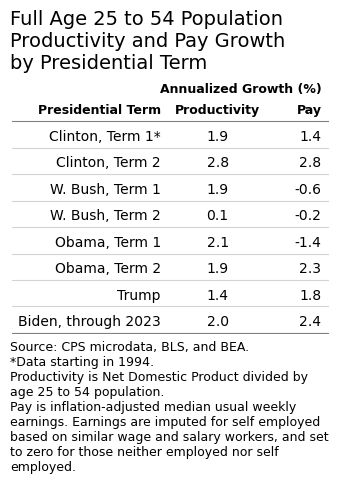
To show this effect, here’s the annual growth rates from the chart above, grouped by presidential term. If we take out the labor composition effect, Biden’s results look pretty good. Productivity and real wages are both growing at an above-average rate and the gap between the two is closing.
- For example, my productivity measure is not particularly meaningful on its own. In development economics its relatively common to consider GDP per capita as a measure of productivity, but in the US we typically measure productivity as GDP per hour of work, which causes the aforementioned labor composition issues. So using NDP per 25 to 54 year old is a compromise to avoid composition issues, to avoid issues from changing age demographics, and to be consistent with the age 25 to 54 pay measure. ↩︎
