Dashboard update: mixed, but mostly bad

Latest Dashboard: Macro and Markets Dashboard: United States (PDF)

Data over the past week has been both terrible and good, as US equity markets had their worst ever start to the year, but the jobs report was positive. Volatility in Chinese equity markets has been largely cited as the cause for the U.S. sell off. The S&P 500 fell nearly six percent during the week (see below). Oil (WTI) fell about three dollars a barrel over the week.

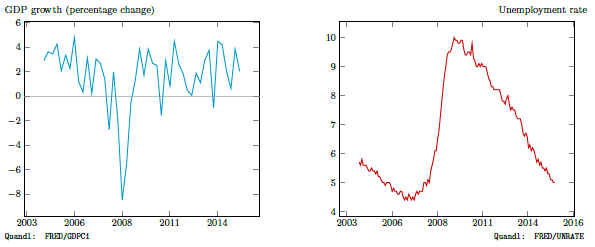
Meanwhile, jobs data showed a slight uptick in the extraordinarily low labor force participation rate, and a stable five percent unemployment rate. These, the jobs increase, and wage figures, are better than what was generally expected.

The trade weighted dollar strengthened, as the dollar strengthened by more than a percent over the British pound and Chinese yuan during the week, and by more than 3.75 percent against the Australian dollar. It now takes more than 1.41 Canadian dollars to buy a U.S. dollar.

The Fed’s H.4 report shows lots of activity as the reverse repo offerings reflect the Fed’s unconventional tools for draining liquidity from markets. Excess reserves of depository corporations have fallen to their lowest level since 2013 (see far below).

sp


fed

Dashboard update: new year

Latest Macro and Markets Dashboard: United States

I’ve made some adjustments to the dashboard. Several new variables have been added, including the purchasing managers index (below), which is dangerously low (48.6 in November). New labor market indicators cover wage and output growth, which have reversed after a long stretch of relative wage stagnation, and the labor force participation rate, which remains low, even as unemployment returns to medium-run equilibrium levels.

Equity market coverage has been expanded to cover the Dow Jones Industrial Average, and the Nasdaq-100. The Nasdaq has dramatically outperformed the DJIA and S&P 500 since the financial crisis. I’ve also added the Shiller index of price to earning ratios. On the index charts, I’ve added a light gray moving average line, which factors in the 50 weeks before the present value.

As the federal funds rate increases over the coming years, it will be interesting to track some bond market indicators, such as real yield curve rates on treasuries, and corporate bond yields. These variables have been added to the dashboard.

pmi

Dashboard update: quiet holiday week

The latest dashboard: Macro and Markets Dashboard: United States

U.S. markets were relatively quiet during the short week. Market volatility, as measures by the VIX, decreased during the week. The dollar weakened against the euro, yen, and yuan, but strengthened against the rand, Mexican peso, and real.

Interestingly, as noted in this week’s episode of FT Alphachat, two of the best performing assets during 2015 were Ukrainian and Argentine sovereign debt!

VIX

Dashboard update: Fed rate hike

Latest dashboard: Macro and Markets Dashboard: United States

The Fed’s first rate hike since the crisis has taken place smoothly. The S&P was up on Wednesday, following the announcement, but closed basically flat on the week. Oil closed under $35 a barrel on Friday, and the U.S. Dollar strengthened further against the Canadian dollar, the South African Rand, and the Russian Ruble.

Monthly CPI figures showed that inflation remains practically zero. Capacity utilization was down half a percent on the month.

DFF

Dashboard update

The latest version of the US macro and markets dashboard is now available. In this update, I’ve appended a table which shows the value of the U.S. dollar vis-à-vis other currencies. Notable developments include the U.S. dollar strengthening against the Canadian dollar earlier in the week, and the South African Rand (ZAR) weakening by more than three percent against the dollar over on Friday.

Elsewhere in the dashboard, crude oil prices have fallen further, the personal savings rate climbed to 5.6 percent, and the unemployment rate remained flat at 5 percent. The S&P 500 fell 78 points during the week. The effective federal funds rate has been near zero since late 2008, so it will be interesting to see how markets react to the outcome of the next FOMC meeting. Most economists predict a rate hike of 0.25 percent.

exrates

Macro and Markets Dashboard

To monitor for interesting economic developments, I’ve created a dashboard of 24 macroeconomic and market-related indicators. The wide variety of indicators include GDP growth, the trade-weighted dollar, food prices, and U.S. government bond yield spreads.

All indicators are retrieved from Quandl using Stata, so updates take only two clicks. Please check out the dashboard and send me your feedback.

Capture